We keep telling you not to trust a proxy meter, ours included, until you have counted the same traffic yourself. Counting it yourself usually means wrapping every request in your scraper with a byte counter. If your tools go through ProxyDesk, that work is already done: it counts every connection it carries, on your machine, and exports the lot as CSV.
This post covers what that count holds, what it leaves out on purpose, how to read the export with a short Python script, and how to hold it up against our meter without fooling yourself. One thing first, said plainly: ProxyDesk’s log is its own count. It is not your bill, and it never sees ours. That is exactly why it is worth having.
What ProxyDesk counts
Open the Activity page. The top-left panel is Your traffic, this session: connections, bytes up, bytes down and how many failed. Next to it, Health-check traffic counts the checks ProxyDesk runs on your proxies, kept apart so they never pad your figures. Below, Recent connections lists each connection your apps made, with its destination, the proxy that carried it, the result and the bytes. Pool events, the other tab, is the history of proxies being benched and coming back.
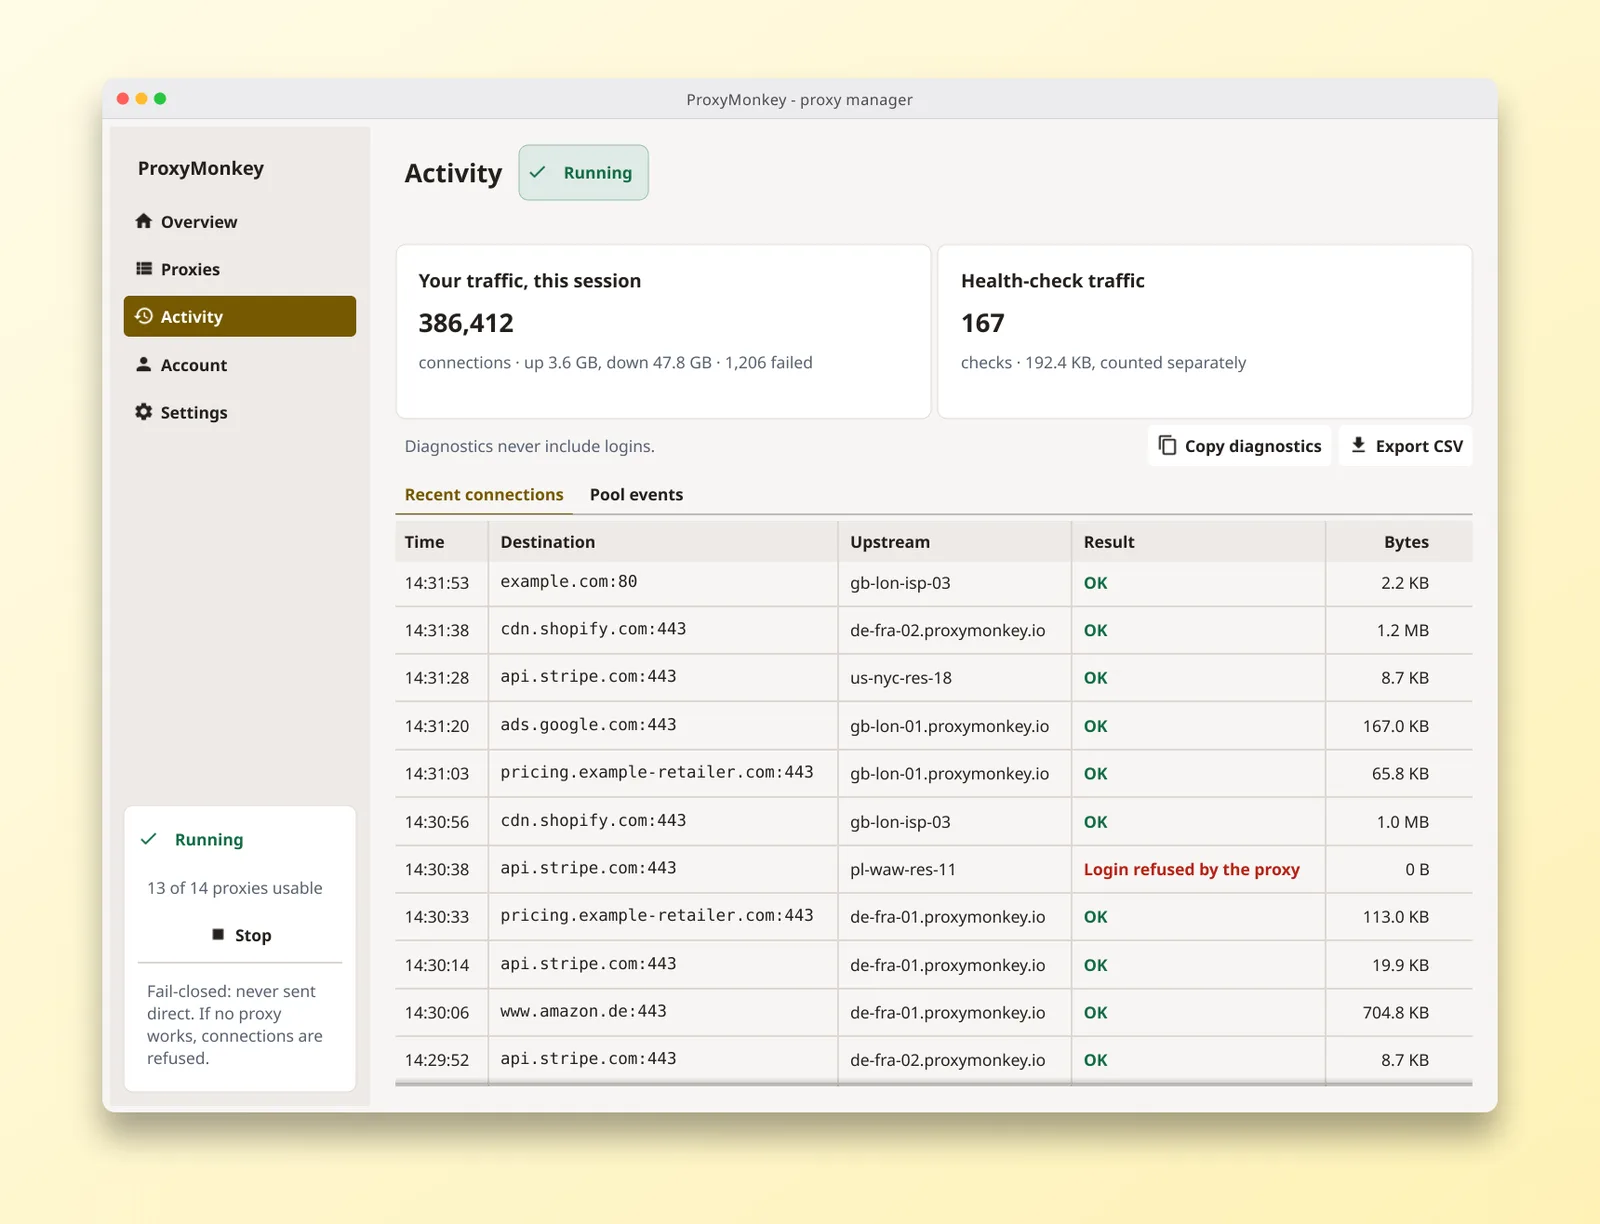
A row is written when a connection ends: bytes up is what your app sent through the tunnel, bytes down what came back. A connection ProxyDesk could not place is written too, with zero bytes and the reason.
What it leaves out, on purpose
- Health checks. Counted in their own panel and never in the log or your session totals.
- The proxy’s own handshake. The count starts once the tunnel to the target is open. The login ProxyDesk sends to the proxy, and the request that opens the tunnel, are not in it.
- Old rows. The log keeps the latest 500 connections, in memory. Pressing Start begins a fresh log, so export before you start again.
- Requests. A row is a connection, not a request. One connection kept alive by your HTTP client can carry many requests, so the row count will not match a per-request log. Compare totals, not rows.
Export it
Press Export CSV on the Activity page and pick a folder. The file name defaults to proxydesk-activity- plus the date and time. The columns come straight from ProxyDesk’s exporter:
| Column | What it holds |
|---|---|
| time | When the connection ended or failed, in UTC, like 2026-11-06T09:14:03Z |
| destination | The host and port your app asked for, like shop.example:443 |
| upstream | The proxy that carried it: its label, or its address when it has none. Empty when no proxy was found |
| result | ok or failed |
| cause | Empty for ok. Otherwise one of login_refused, proxy_auth_required, unreachable, timeout, dns_failure, protocol, plan_expired, no_upstream or unknown |
| error | The raw error text behind the cause |
| bytes_up | Bytes your app sent through the tunnel |
| bytes_down | Bytes that came back |
There is no login column. One small courtesy: a cell that starts with =, +, - or @ gets an apostrophe in front, so a spreadsheet shows it as text instead of running it as a formula. A sample file looks like this:
time,destination,upstream,result,cause,error,bytes_up,bytes_down
2026-11-06T09:14:03Z,shop.example:443,Germany ISP,ok,,,1834,48211
2026-11-06T09:14:12Z,api.example:443,,failed,no_upstream,no healthy upstream available,0,0
Read it with a short Python script
Standard library only. It adds up successful connections per host, heaviest first, and counts failures by cause:
import csv
import sys
from collections import Counter, defaultdict

per_host = defaultdict(lambda: [0, 0, 0])
failures = Counter()

with open(sys.argv[1], newline="") as f:
    for row in csv.DictReader(f):
        if row["result"] != "ok":
            failures[row["cause"]] += 1
            continue
        host = row["destination"].rsplit(":", 1)[0]
        stats = per_host[host]
        stats[0] += 1
        stats[1] += int(row["bytes_up"])
        stats[2] += int(row["bytes_down"])

for host, (conns, up, down) in sorted(per_host.items(), key=lambda item: -sum(item[1][1:])):
    print(f"{host:30} {conns:5} conns  up {up:>12,}  down {down:>12,}")
for cause, count in failures.most_common():
    print(f"failed: {cause:20} {count}")
Save it as summarise.py and run python3 summarise.py proxydesk-activity-….csv. On a short sample file it prints:
shop.example                       2 conns  up        3,624  down       99,213
api.example                        1 conns  up          912  down        3,307
failed: no_upstream          1
failed: login_refused        1
A pile of login_refused means a password changed under you. plan_expired means a proxy’s plan has ended. no_upstream means every proxy was benched at that moment, which is ProxyDesk refusing to send your request out on your own IP, exactly as designed. The ProxyDesk quick start explains the benching.
What the log tells you besides the total
- Lots of small connections to one host. Your client is opening a fresh connection per request, and every fresh HTTPS connection pays for a new TLS handshake, which is real bytes on any meter. A session that keeps connections alive cuts that. The catch: with ProxyDesk’s default of a new proxy for each connection, a kept-alive connection also stays on one proxy for longer. Rotating vs sticky helps you decide which you want.
- Hosts you never meant to visit. Something else on the machine is pointed at ProxyDesk. The usual suspect is a shell where you exported
ALL_PROXYand forgot: every tool started from it goes through your proxies, and through your balance. - Failures that all name one proxy. Its login changed or its plan ended. Pool events shows when ProxyDesk benched it.
Hold it up against our meter
- Note when you pressed Start and when you exported. That is your window.
- Export the same window from the usage log in your dashboard.
- Sum bytes per host on both sides. Add ProxyDesk’s health-check figure to its side first: those checks went through your proxies too, so our meter saw them even though your log does not list them.
Expect our number to come out a little higher than yours. We meter request and response bytes including headers and protocol overhead, and ProxyDesk’s count starts after the proxy handshake, so a small gap in our direction is normal. Rows with zero bytes should cost nothing, because connections that fail before moving data are not billed. Ours coming out lower than yours is unusual; check the window first.
Ours coming out a lot higher is what the whole meter promise is for. Bring both files to Discord. For the request-by-request version of this check, with a script on each side, read auditing your proxy bill; for the ways cheap providers pad a meter, and how to spot each one, catching usage inflation.
Top-ups start at $5.
One shared datacenter IP for 30 days is $1.25. A single gigabyte of residential is $2.40. The balance never expires.